
Product Tour
Product Tour
Enterprise Architecture and Business Process Management Software Demo
See how GlobeArc combines Enterprise Architecture and Business Process Management in one connected platform.
The Product Tour shows how shared enterprise information supports BPMN process models, capability maps, application landscapes, Current and Target states, value scoring, guided analysis, reporting, and AI-assisted queries.
Because these views draw from the same underlying repository, teams can move between process, business, application, and transformation perspectives without rebuilding the information behind each one.
Follow the tour to see how GlobeArc connects enterprise structure with the processes that make the organization operate.

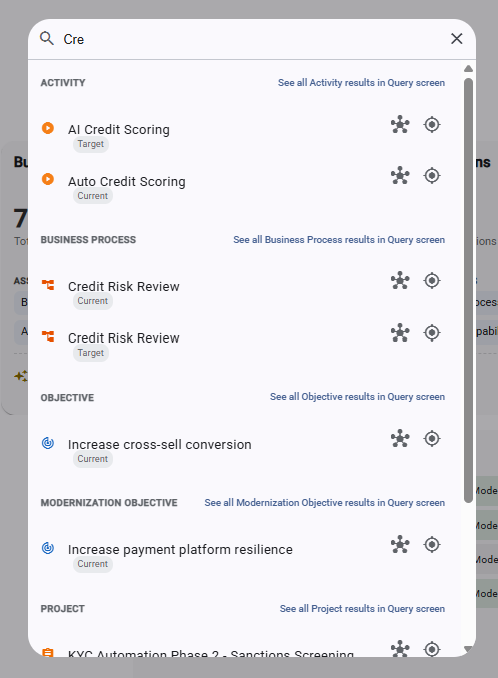
Start With the Connected Enterprise Architecture Repository
The GlobeArc repository is the foundation for everything else in the platform. Applications, capabilities, processes, organizational units, stakeholders, value stream stages, initiatives, and other objects are connected through associations and described by configurable properties.
Instead of creating separate records for every model or report, GlobeArc can reuse the same canonical object across different views. Open an application, for example, and you can explore its properties, related objects, and where else it appears in the architecture.
From the repository, you can:
- Search for architecture objects across the workspace
- Explore properties and relationships
- Follow connections between business and technology objects
- See where an object appears elsewhere
- Navigate related architecture information
- Work within State, Location, and Org Unit contexts
How Does GlobeArc Visualize the Application Landscape?
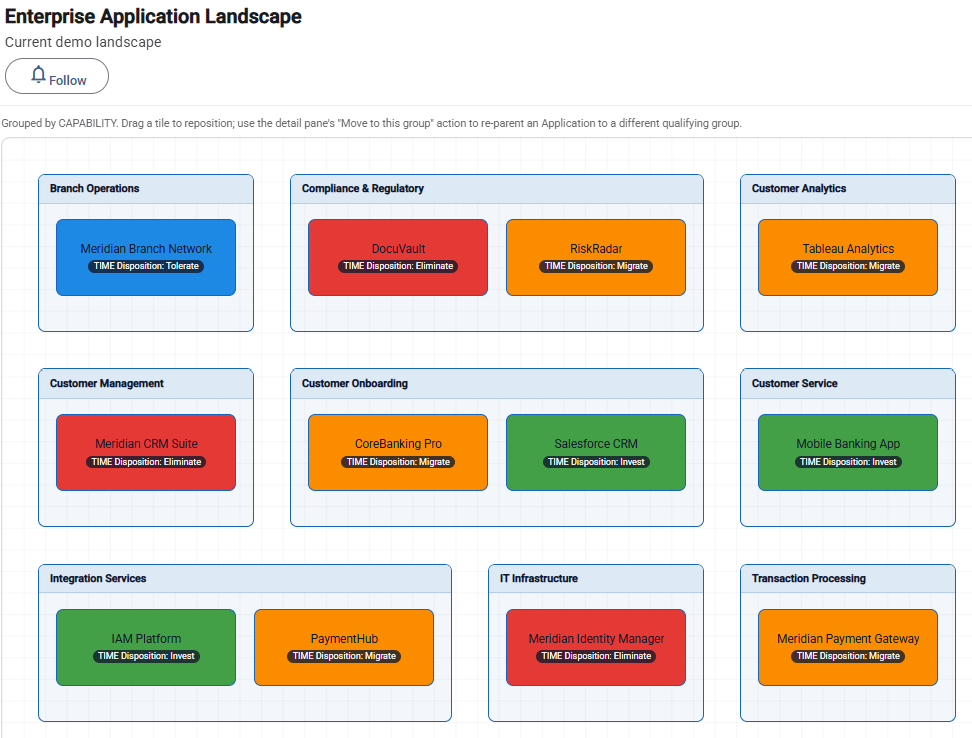
Application landscape models turn repository information into a visual view of the application estate. Rather than manually drawing boxes to recreate information that already exists, GlobeArc generates the landscape from connected application and architecture data.
Applications can be organized using supported grouping dimensions, allowing teams to examine the estate in the context that matters to the question. Heat maps can then add an analytical layer, helping users move from seeing the landscape to understanding what the underlying information says about it.
A landscape can help teams examine:
- Application distribution across business capabilities
- Application concentration
- Cost exposure
- Current and Target application estates
- Integration context
- Differences across organizational perspectives
How Does GlobeArc Connect BPMN Process Modeling to Enterprise Architecture?
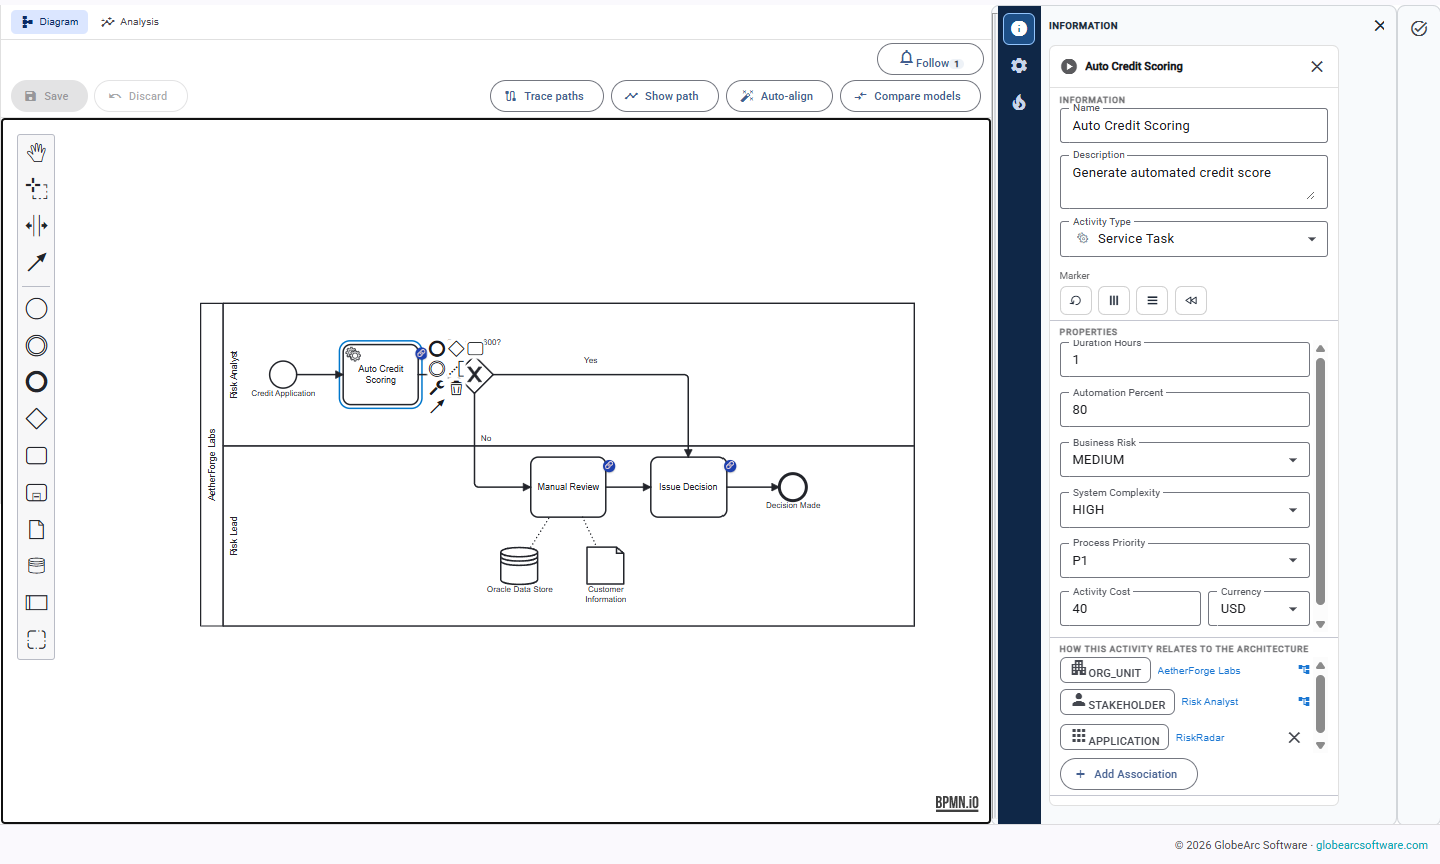
Process models can reference the same people, organizational units, applications, and other objects used elsewhere in the architecture repository. That means BPMN doesn't have to exist as a separate documentation layer disconnected from enterprise architecture.
Lanes can resolve to stakeholders, organizational units, and locations, while activities can connect to applications and other enterprise information. The result is a process model that can show not only how work flows, but also who participates, which systems are involved, and how the process connects to the broader organization.
Process models can also be simulated, and the Process Analysis view compares Current and Target variants on cost, duration, waiting time, and team capacity.
How Does GlobeArc Compare Current and Target Architecture?
Current, Interim, and Target states are part of the architecture context, so teams can compare change without maintaining unrelated copies of the same model.
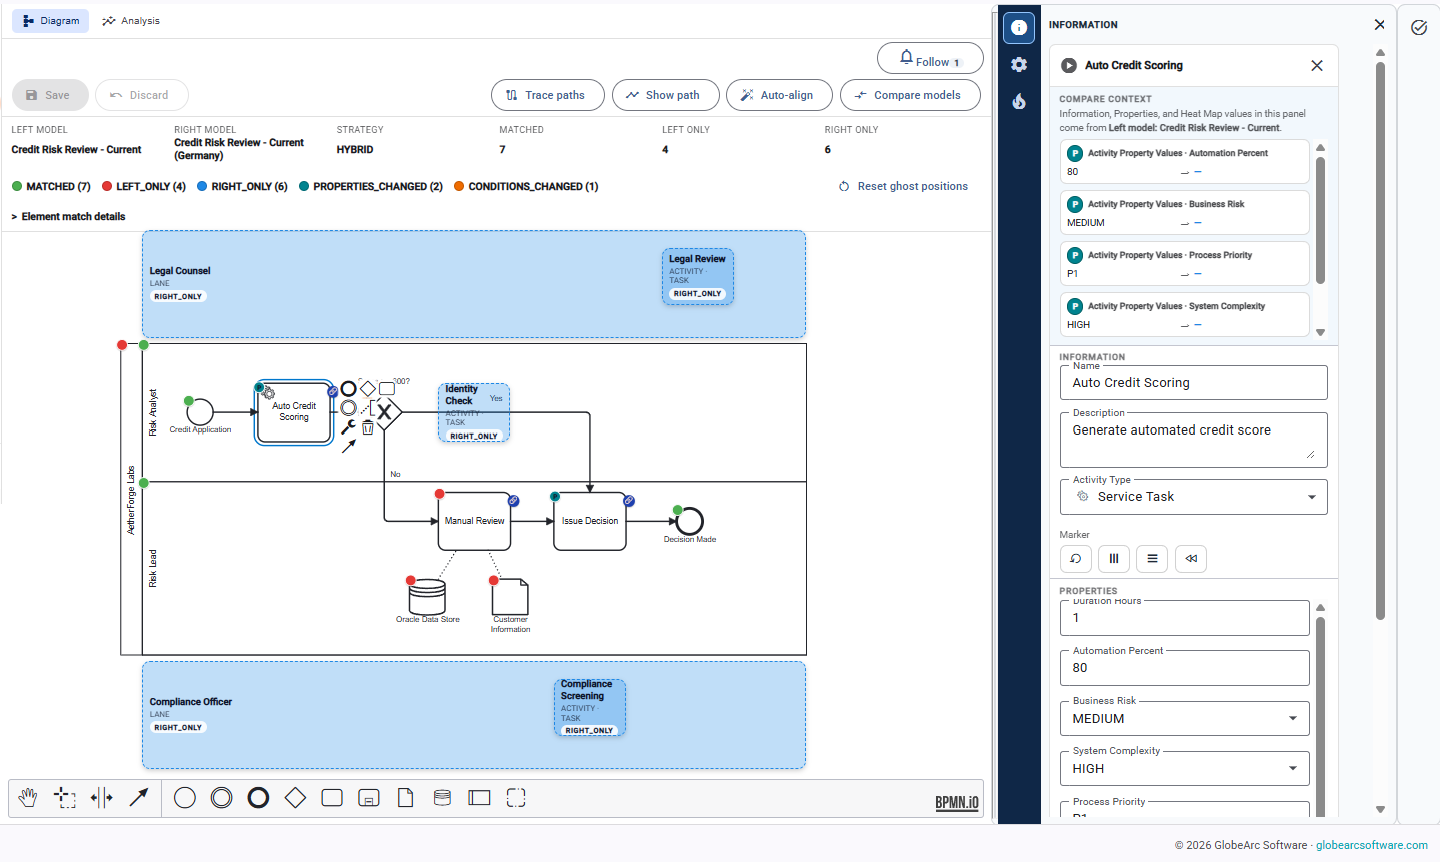
Compare States can show structural differences and directional property changes, while BPMN model comparison can highlight matched, renamed, changed, added, and removed process elements. The same underlying architecture can therefore be examined from different points in the transformation journey.
Teams can use those comparisons to answer questions such as:
- What exists in Current but not Target?
- What appears only in the Target state?
- Which properties change between states?
- How does a BPMN process change between variants?
- How does the application estate differ between Current and Target?

How Do Use Case Blueprints Guide Platform Setup?
Teams can start with the business question they need to answer instead of designing the entire metamodel upfront. Use Case Blueprints identify the information required for a specific use case and show where the current repository has gaps.
A Blueprint can identify required object types, association types, and properties, then help teams establish missing metamodel elements where appropriate. That makes setup more practical because the structure is tied directly to a real decision.
This changes the starting question from "How should we model our entire organization?" to "What information do we need to answer this decision?"

How Does GlobeArc Turn Connected Enterprise Information Into Decision Support?
The platform brings repository data, analysis, dependencies, and business context together so teams can move from understanding what exists to deciding what should happen next.
A team investigating application rationalization might move from repository records to a capability view, examine application value, inspect dependencies, and produce a rationalization report. A transformation team might compare Current and Target states to understand what needs to change. A risk team might trace a vendor through applications, capabilities, processes, and organizational units to understand concentration and exposure.
The path changes with the question, but the underlying principle stays the same: the models, analytics, queries, and reports draw from connected architecture information rather than requiring teams to reconstruct the enterprise for each decision.
How Does GlobeArc Score Application Value?
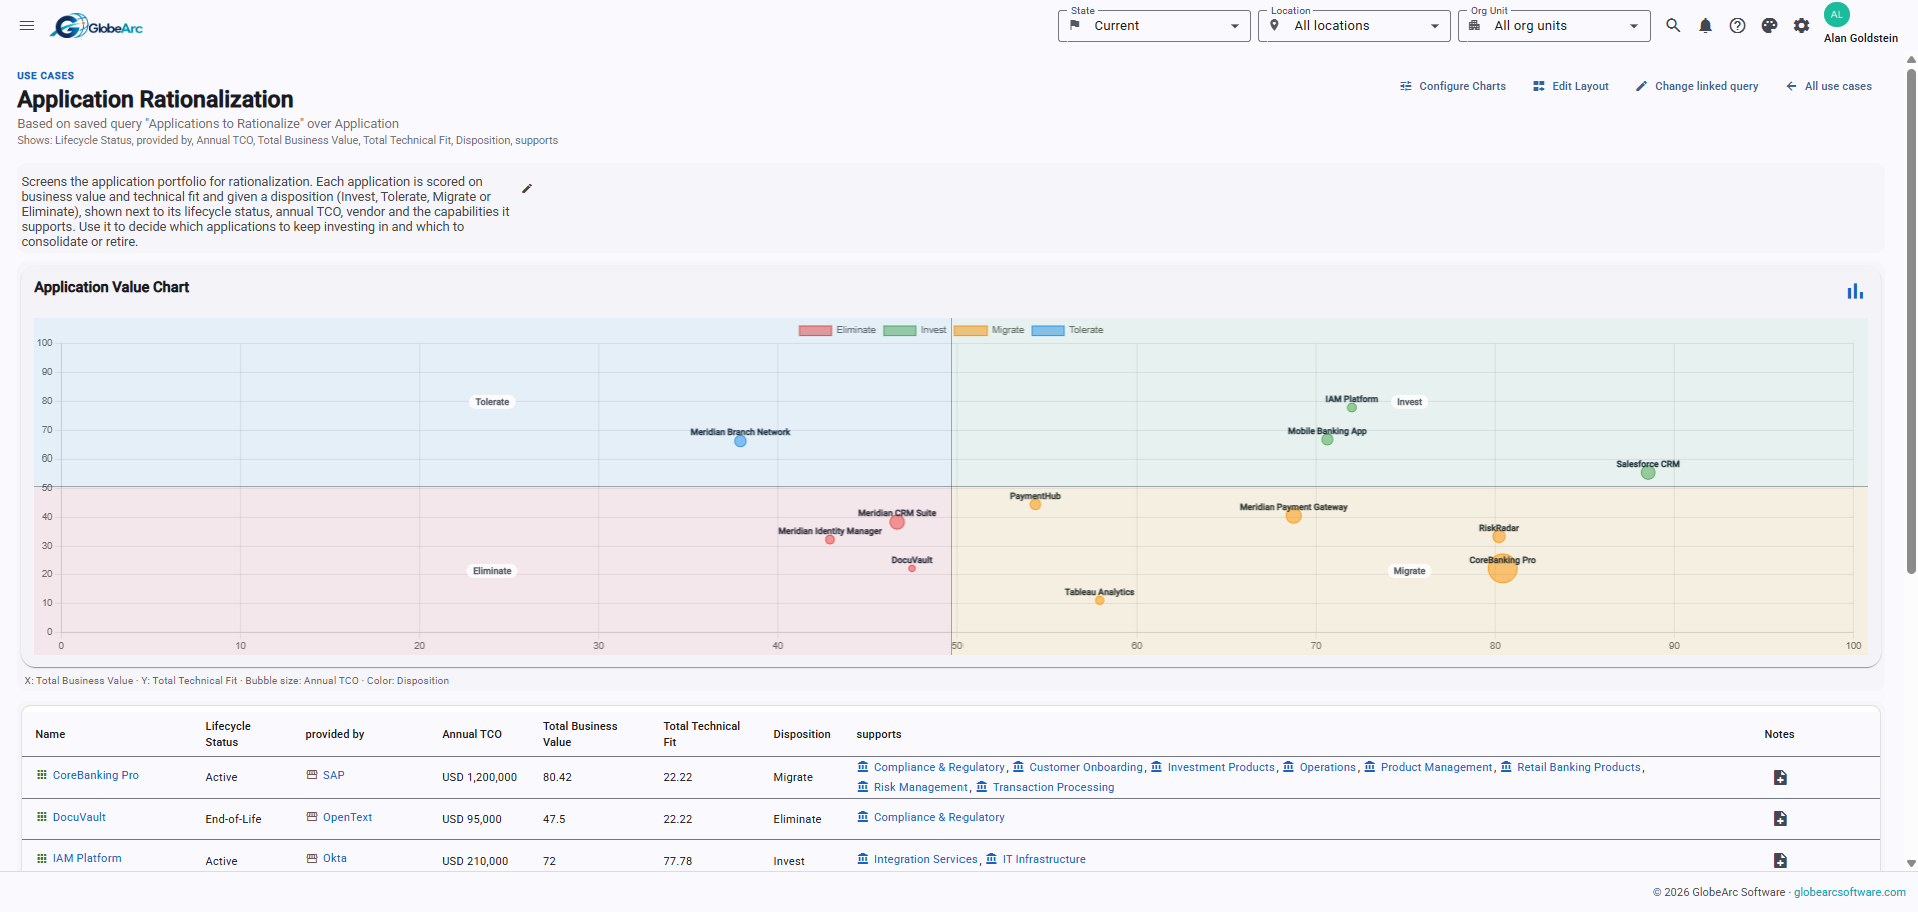
Business Value, Technical Fit, and application disposition can be calculated from visible criteria rather than hidden behind an unexplained rating. Configurable inputs and tunable weights give architecture teams a clearer way to defend why an application has been scored the way it has.
Applications can then be plotted on a Value Chart, with Technical Fit on one axis, Business Value on the other, and additional information such as total cost represented in the view. The score supports the decision, but it doesn't replace the judgment of the architecture or portfolio team.
Teams can examine:
- Business Value
- Technical Fit
- Calculated disposition
- Total cost of ownership
- Data completeness
- Portfolio position
- Supporting inputs behind the score
How Can AI Query Enterprise and Process Data?
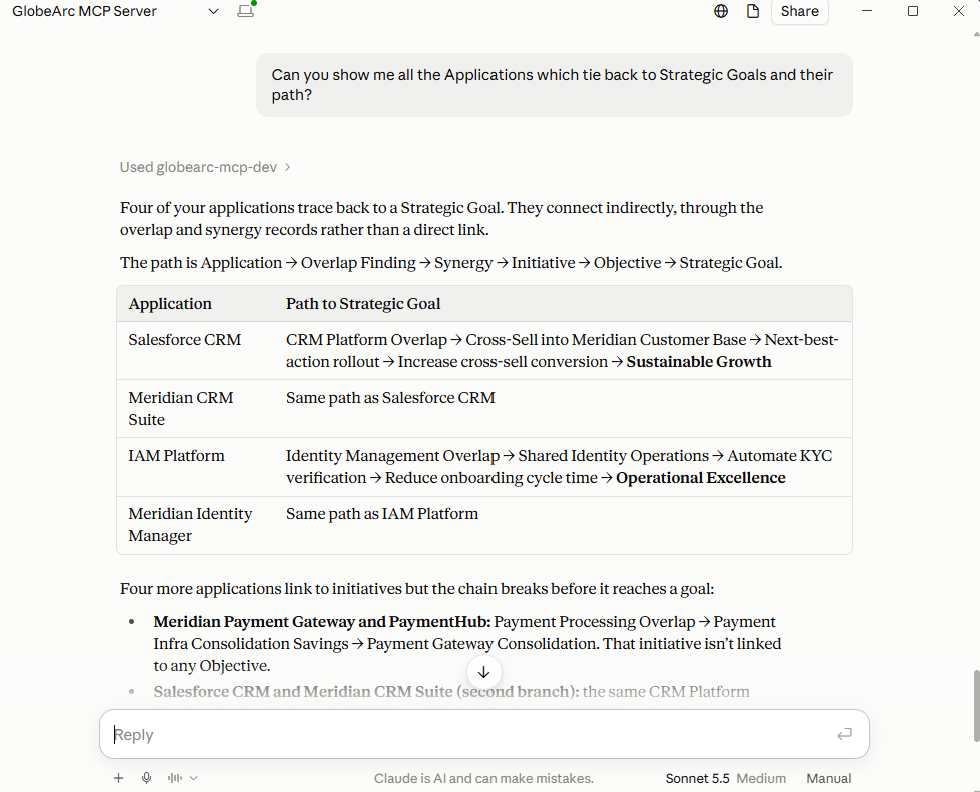
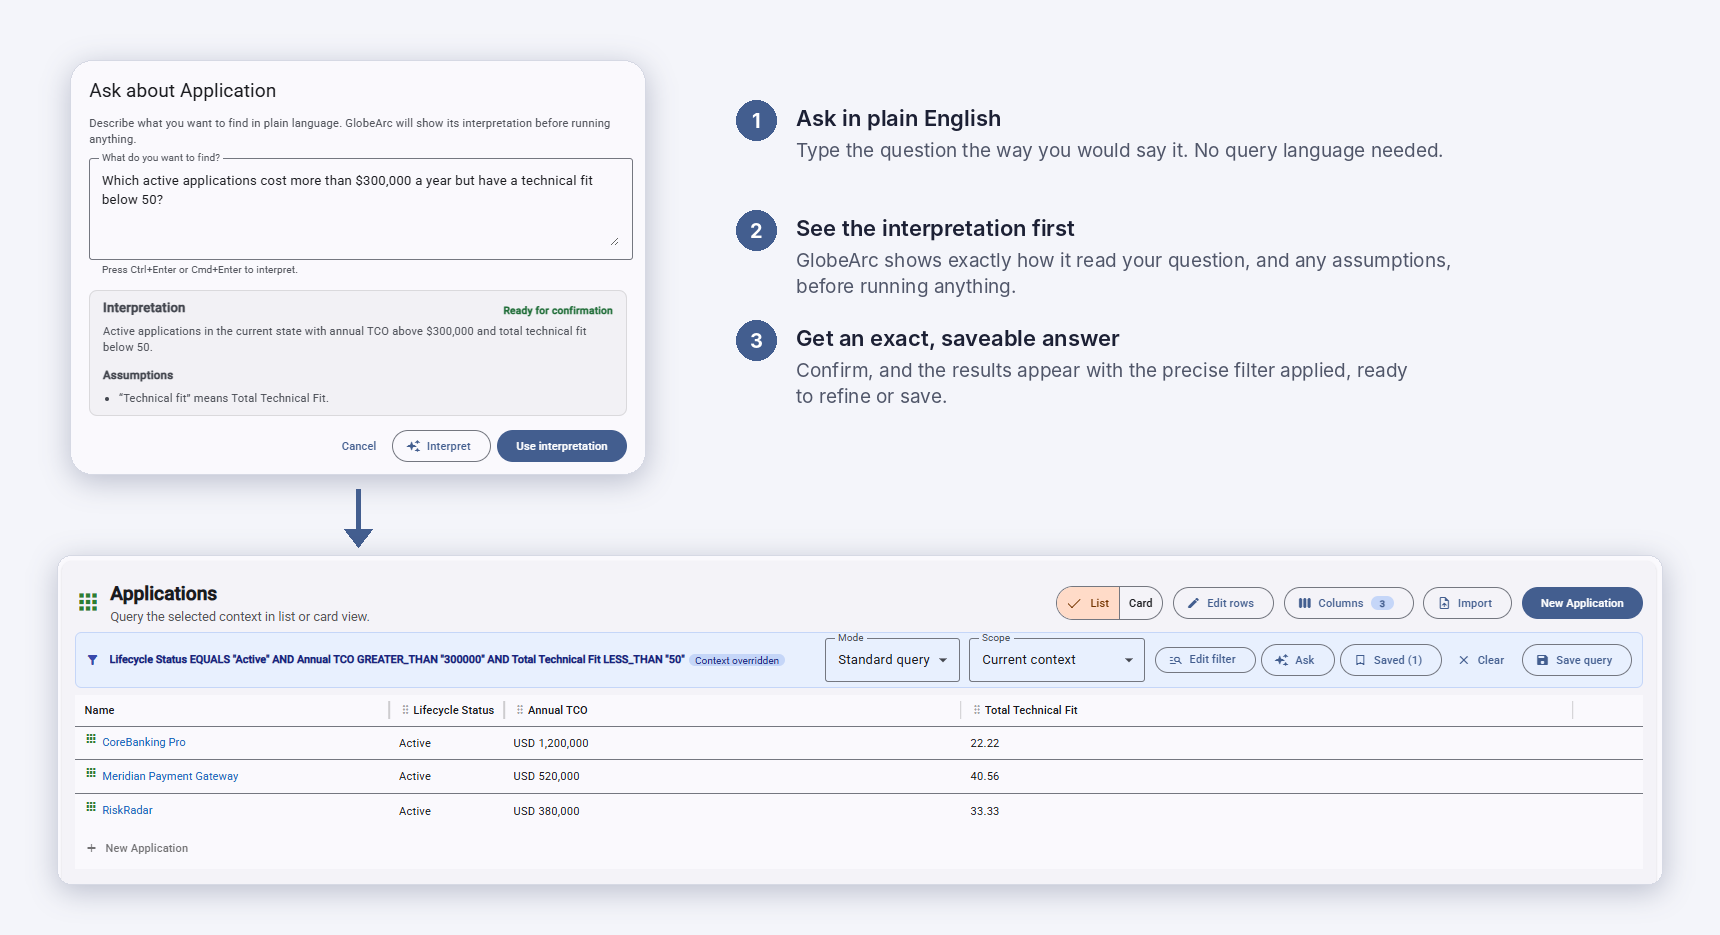
GlobeArc's MCP capability allows compatible AI assistants to work with information through a controlled query pathway. Instead of requiring users to understand the mechanics of retrieving connected data, AI-assisted workflows can begin with a natural-language business question.
Examples might include:
- Which applications support this capability?
- What is connected to this application?
- Which organizational units perform this capability?
- Which processes depend on this part of the architecture?
- What information exists for this architecture state?
The AI doesn't receive direct database access or generate raw SQL for execution. Query requests use GlobeArc's validated query architecture, with authenticated access, OAuth scopes, tenant boundaries, and platform permissions remaining part of the interaction.
How Does GlobeArc Turn Connected Data Into Analysis and Reporting?
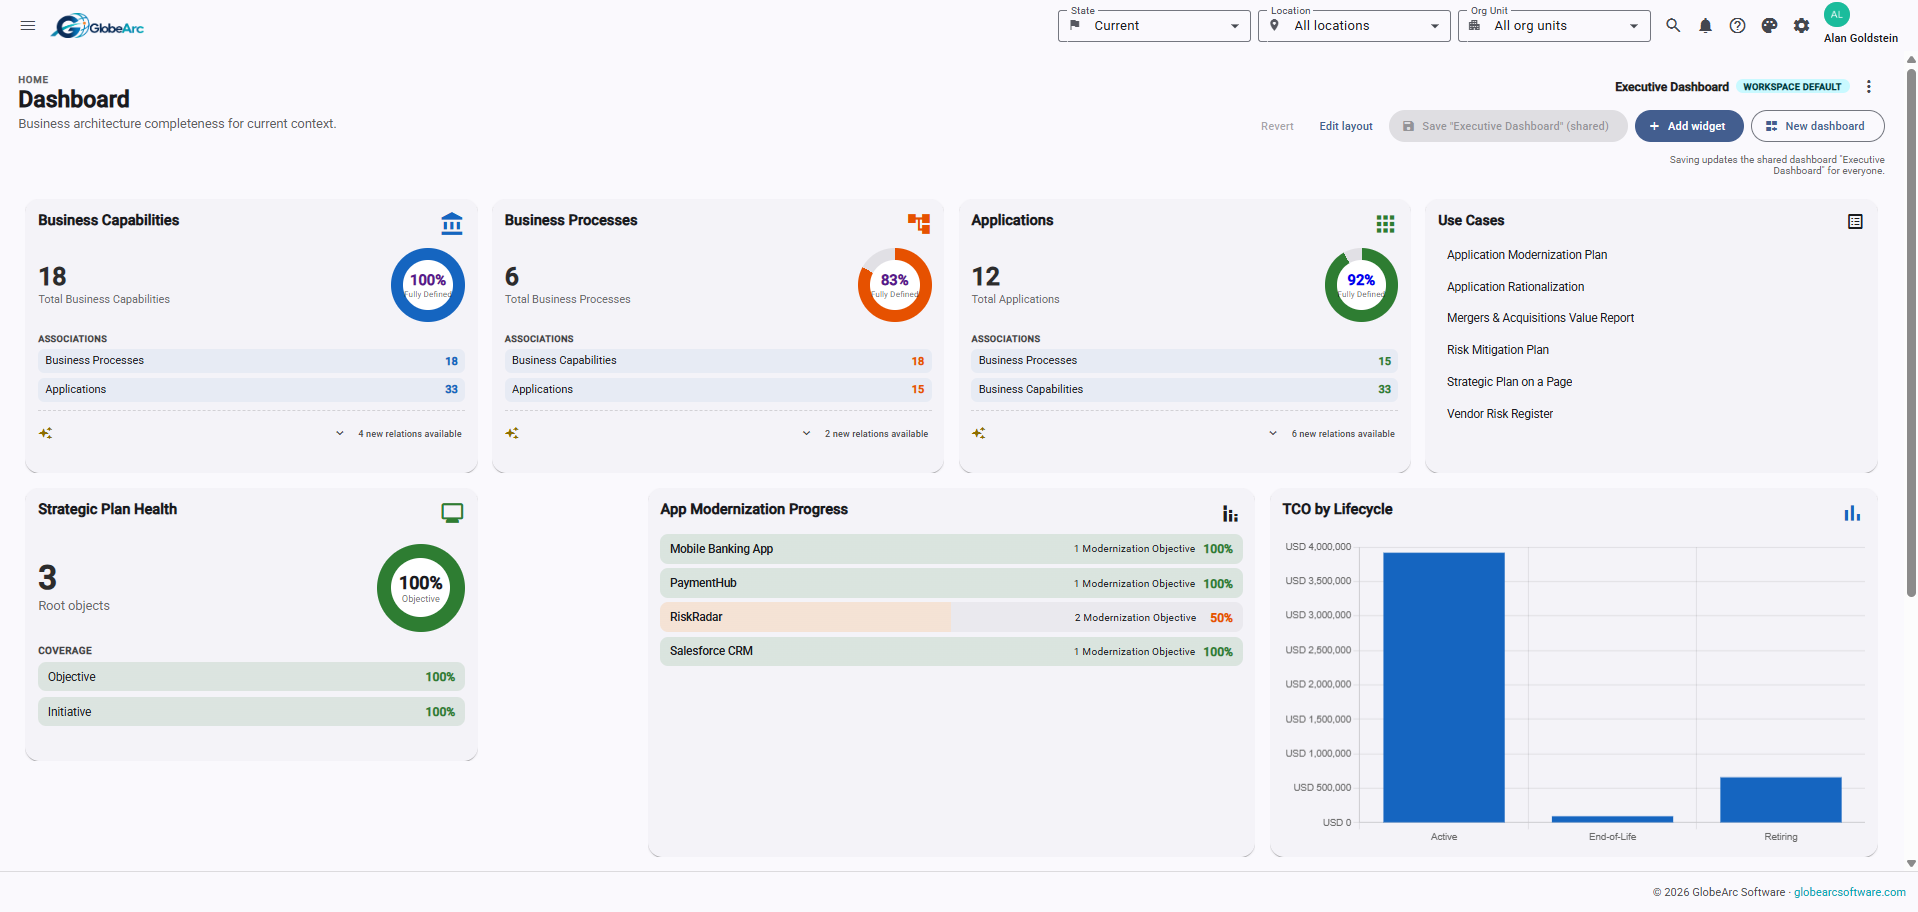
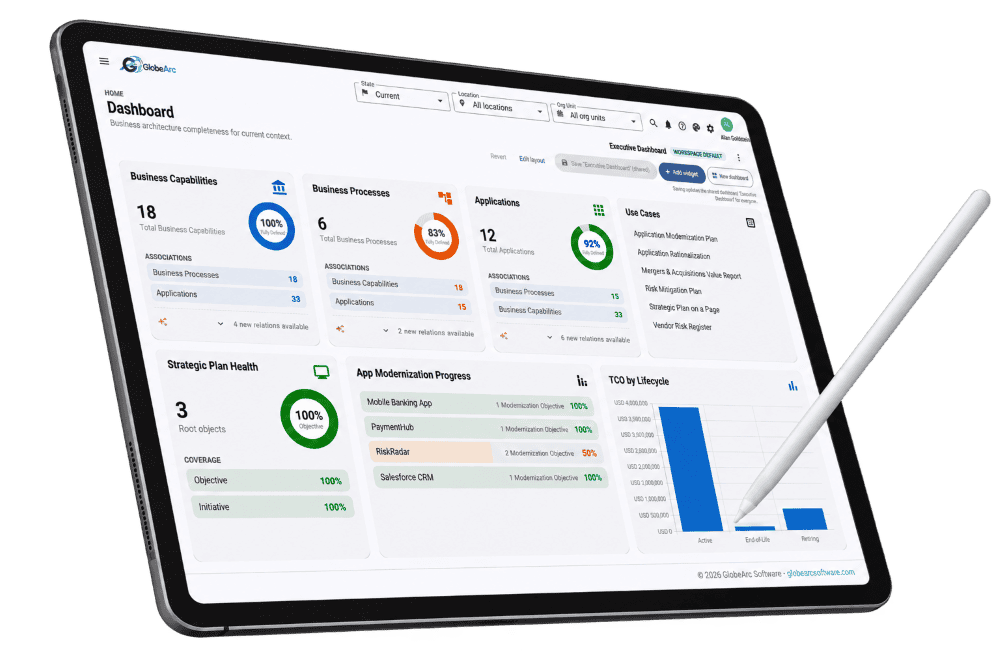
The same connected repository information can feed heat maps, saved queries, dashboards, reports, and visual models. Teams don't need to rebuild a separate analysis dataset every time they move from exploration to reporting.
GlobeArc's shared heat-map engine works across multiple visual model types, while calculated properties can support sums, averages, weighted formulas, classifications, and value scoring. Saved queries make useful questions repeatable as the underlying architecture changes.
Analysis can move across:
- Business capability maps
- Value streams
- BPMN process models
- Application landscapes
- Saved queries
- Dashboards and widgets
- Structured reports
How It Works
What Can You Do in GlobeArc?
GlobeArc turns complex organizational data into clear, actionable intelligence that helps leaders make smarter decisions faster.
1
Explore Architecture Information
Search one connected repository of architecture and process information to understand applications, capabilities, processes, people, and how they relate.
2
Visualize the Application Estate
Get a clear view of your application landscape, identify dependencies, and understand how different systems connect across the organization.
3
Open a Connected BPMN Process Model
Explore business processes through connected BPMN models to understand workflows, activities, and their relationships with enterprise applications.
4
Simulate and Analyze a Process
Run a BPMN process through simulation, trace work step by step, and compare Current and Target variants on cost, duration, waiting time, and team capacity.
5
Compare Current and Target Architecture
Evaluate your existing architecture against the target state to identify gaps, understand changes, and plan transformation initiatives.
6
Assess Application Value
Evaluate applications using visible scoring criteria to understand Business Value, Technical Fit, and Disposition.
7
Use a Blueprint for Decision-Making
Discover the information needed to make informed decisions through structured Blueprints that bring relevant architecture data and evaluation criteria together.
8
Ask Architecture Questions with AI
Use a compatible AI assistant to explore architecture information, ask questions in natural language, and gain insights from connected enterprise data. Ask questions in plain English with GlobeArc’s built-in Ask feature or your company’s own AI assistant.
9
Turn Data into Actionable Insights
Transform connected architecture data into meaningful analysis, reports, and decision context to support strategic planning and enterprise decision-making.
The best way to evaluate GlobeArc is to follow a real question through the platform. Rather than viewing features in isolation, you can see how repository data becomes a model, how a model becomes analysis, and how that analysis provides evidence for an enterprise decision.
We’re here to help you bring clarity to complexity.